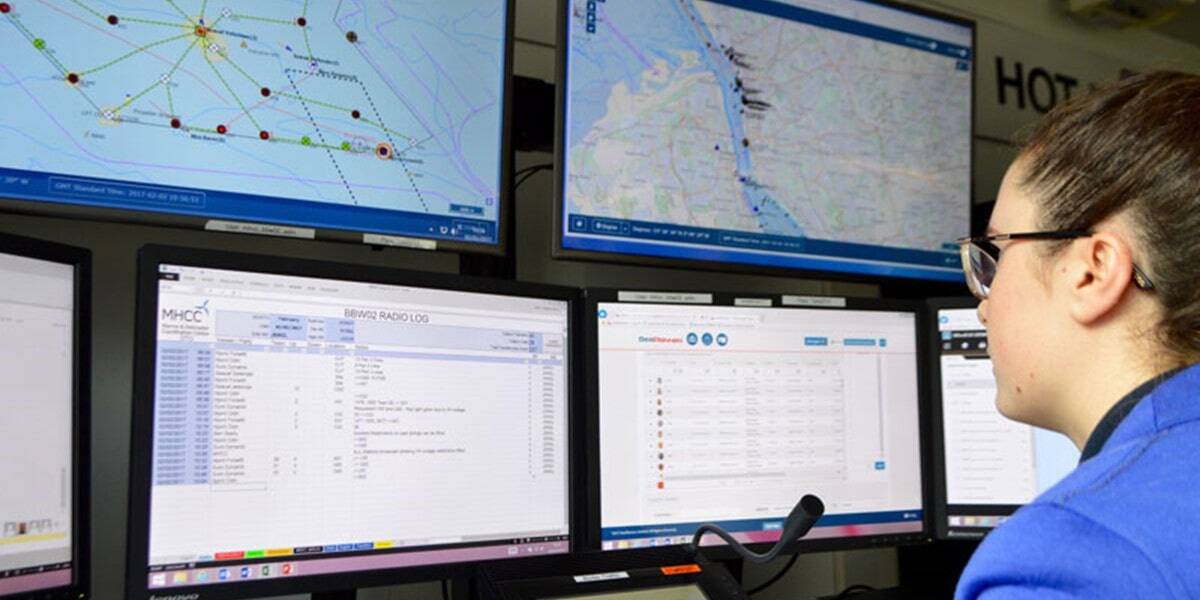
The scientific art of mapping allows people to see a bird's eye view of an area of importance without needing to physically be near the area. Evolving from paper cartographic charts to digital mapping through GIS software and currently having the ability to view maps online provides a great tool to visualise and maintain complex geographical information in an intuitive medium.
Offshore wind farms face the challenge of having onshore, offshore, and underwater assets often situated a considerable distance into the sea that are responsible for generating renewable energy. These assets require proactive monitoring to minimise costs associated with issues ranging from cable damage to vessel intrusion. The management of offshore wind is often conducted from centralised marine coordination centres and head offices requiring remote visualisation of the site with accurate and up-to-date data.
Offshore Site Visualisation
Through the life cycle of an offshore wind farm information is required from various sources such as planning applications, environmental surveys, geophysical surveys, as-built records and design specifications in varying formats, some requiring specialist software and skills to manipulate.
The importance of having a simple, easily accessible interface, such as a web map, to provide a single source of truth available to all required stakeholders without the need for specialist software allows the right data to be in the right hands during decision making processes.
Benefits of visualising an offshore wind farm using a web map include:
- Centralised Data Store
A centralised data platform that is accessible by all stakeholders enables a more efficient and streamlined decision making process. Displaying distributed data in one portal enables information to be easily shared and understood. - Flexibility
The ability to switch layers on and off allows users to focus their interest on the information required to complete the current task. - Accessibility
A secure, online, interactive, intuitive interface that is available remotely via a web browser removes the barriers associated with specialist software and ensures all relevant stakeholder decisions are made based on the same set of data. - Improved Data Sharing
The ability to upload and download data allows disparate teams, possibly using different systems, to easily view and use site data. - Information Linking
The ability to link documents, reports, and related system information to an asset allows the user to obtain information easily and efficiently. - Lower Operational Costs
Maintaining up-to-date data in a centralised portal that integrates with analysis results allows for proactive maintenance planning.
Regular Monitoring of Offshore Assets
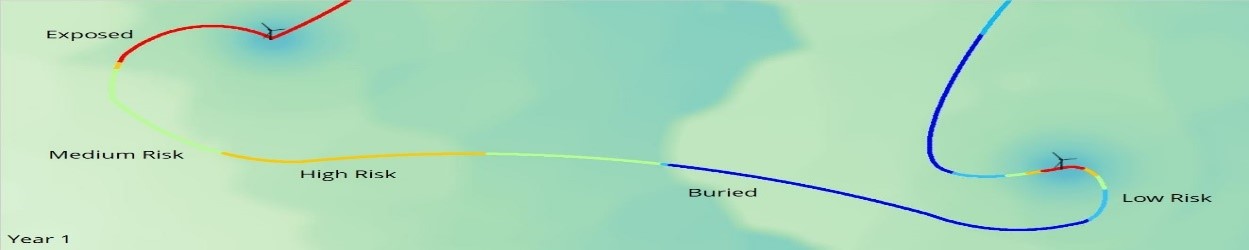
Offshore wind compromises of generation assets subject to the forces of the ocean that require regular monitoring. Monitoring through regular bathymetric surveys allows the data to be analysed to determine the level of scour around turbines and cables. Scour can result in cable damage through vibrations, bending and snagging by fishing, or turbine removal due to undermining the stability of the monopile - all of which result in a loss of revenue and remediation costs. Having analysis results available via an interactive web map enables multiple stakeholders to understand the impact any changes are having on the wind farm at all times.
Evolution of Online Mapping in SeaRoc
Back in 2008, while providing GIS Services to Gunfleet Sands and leveraging their strong GIS consultancy background, SeaRoc (now Ascertra-SeaRoc Limited) developed the SeaPlanner WebGIS to provide a secure portal for users to see the latest site information via a secure web browser from anywhere at any time.
Over the years, Ascertra-SeaRoc Limited has increased the level of information visible from asset information through to bathymetric surveys allowing users to interrogate the gridded rasterised image to obtain water depths anywhere within the survey results and across available surveys allowing the year-on-year comparison. Additionally, analysis results from seabed monitoring and cable mitigation packages supplying information about water depth changes, monopile scour, and colour coded cable at-risk layers available in an interactive format. SeaPlanner WebGIS has aided RWE Renewables offshore wind farms such as Robin Rigg and Humber Gateway with the monitoring of cable risks, visualising changes in the seabed and turbine scour to aid in the decision making process during operations and maintenance.
“SeaRoc GIS Services have been a very good company to work with. Their unique analysis tools enabled us to proactively remediate single areas of scour on our cables, this enabled us to pin point specific areas ultimately saving on remediation costs. Crucially the proactive analysis ensured we could keep the wind farm generating power and extend the life of our cables & turbines. The system is very user-friendly providing quick online access to all the necessary data in one place to assist in ongoing and planned works.”
- Steve Johnson, Marine Engineer for RWE
Currently, Ascertra-SeaRoc Limited is progressing the online web mapping capabilities from a read-only WebGIS display to an editable, flexible map with integration into the core SeaPlanner Marine Coordination software suite. SeaPlanner Asset Management software allows users to manage the layers in the system, upload GIS vector data, edit features on-screen, and share data between the asset map and the SeaPlanner Operations Map, allowing a separation between the Asset Management map displays and the operational location awareness map. SeaPlanner Asset Management is supporting the construction of Taiwanese offshore wind farms, including Formosa 2 and Yunlin, enabling flexible mapping by GIS departments and marine coordinators providing a continuous update throughout the farm's lifecycle.
Future plans involve moving the final parts of the WebGIS functionality into the SeaPlanner Asset Management suite to provide a secure, flexible, online mapping solution with the option to integrate with other SeaPlanner modules.
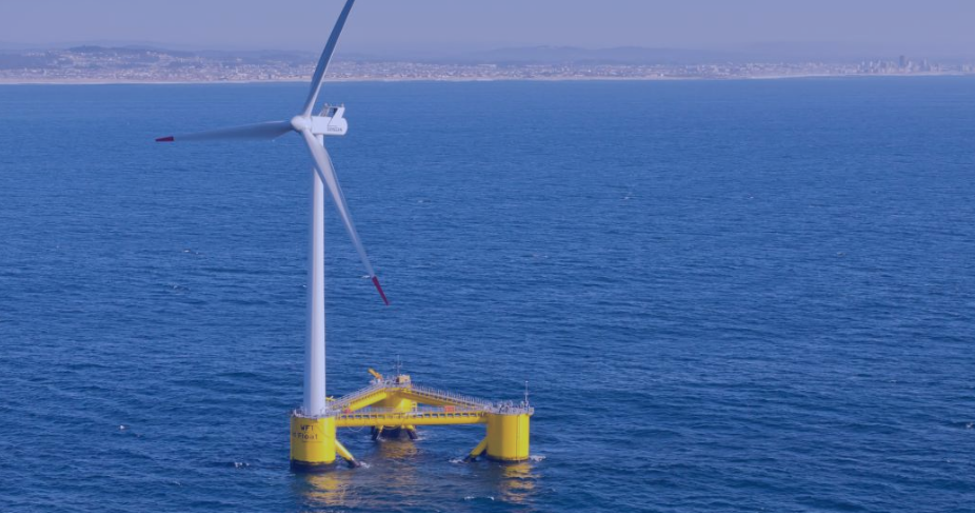
Offshore wind faces new challenges moving into deeper waters requiring the need for current data to be easily available to ensure construction and maintenance activities are undertaken efficiently and safely.
To learn more about how SeaPlanner's online mapping solution and consultancy services can help you improve monitoring of your offshore assets, see our SeaPlanner Marine Coordination software page or contact us to and we would be happy to discuss.